<?xml version="1.0" encoding="utf-8"?><feed xmlns="http://www.w3.org/2005/Atom" ><generator uri="https://jekyllrb.com/" version="4.4.1">Jekyll</generator><link href="/feed.xml" rel="self" type="application/atom+xml" /><link href="/" rel="alternate" type="text/html" /><updated>2026-05-25T18:21:27+00:00</updated><id>/feed.xml</id><title type="html">Gist Labs</title><subtitle>We Get To The Source Of People, Process, And Technology. World-class, deep consulting into the most important aspects of your Strategy, Delivery, and Technology.</subtitle><author><name>John Heintz</name><email>john@gistlabs.com</email></author><entry><title type="html">SAFe PI Planning, Distributed Teams, Conteneo Weave</title><link href="/2017/12/safe-pi-planning-weave/" rel="alternate" type="text/html" title="SAFe PI Planning, Distributed Teams, Conteneo Weave" /><published>2017-12-01T17:00:00+00:00</published><updated>2017-12-01T17:00:00+00:00</updated><id>/2017/12/safe-pi-planning-weave</id><content type="html" xml:base="/2017/12/safe-pi-planning-weave/"><![CDATA[<p>This is all content that a) comes from https://conteneo.co/, b) is great for distributed teams, and c) I highly recommend and use myself.</p>

<p><img src="/assets/f1-large-scale-pi-planning.png" alt="SAFe PI Planning" /></p>

<p>A challenge faced by many SAFe organizations is creating an efficient PI planning process: one in which the in-person meeting advocated by SAFe generates high-impact, actionable results.</p>

<p>One of the reasons why this is hard is that the PI planning meeting is the first time the team is exposed to PI goals and requirements is when the team attends the in-person meeting. That’s too late. Members of the Agile Release Train are vastly more effective if you engage them before the release.</p>

<p>The key word? Engage. We don’t mean asking them to read a document. That quickly leads us down the slippery slope to document-centric, Waterfall processes.</p>

<p>Instead we mean: using collaborative frameworks in Weave so that teams can have the dialogs and discussions that increase understanding and lead to collective action.</p>

<p>This post presents a comprehensive toolkit for using Weave to improve your PI Planning and related project Kickoff or Liftoff events. You’re encouraged to mix and match the frameworks captured in this toolkit to meet your needs.</p>

<h3 id="phase-1-pre-meeting-engagement">Phase 1: Pre-Meeting Engagement</h3>

<p>Use these frameworks before the PI planning meeting to get the team engaged without asking or expecting them to make binding commitments. That’s key: the team is not yet ready to make “final” choices or thoughtful plans (that’s the purpose of the in-person meeting).</p>

<p>If multiple teams are involved then have each team engage in one or more forums. This gives you a comprehensive dataset (one forum result for each team), giving you the opportunity to analyze the data for insights and patterns both within and across teams.</p>

<p>The frameworks presented below are ready to go – just click on any image and you’ll start a Weave forum ready to go!</p>

<p><a href="https://weave.conteneo.co/framework/try?id=UN1ROCZI2GAVI4UV5VMRP0TATKNIWIME"><img src="/assets/safe-pi-planning.png" alt="agreeing on priorities" /></a></p>

<h3 id="agreeing-on-priorities">Agreeing on Priorities</h3>

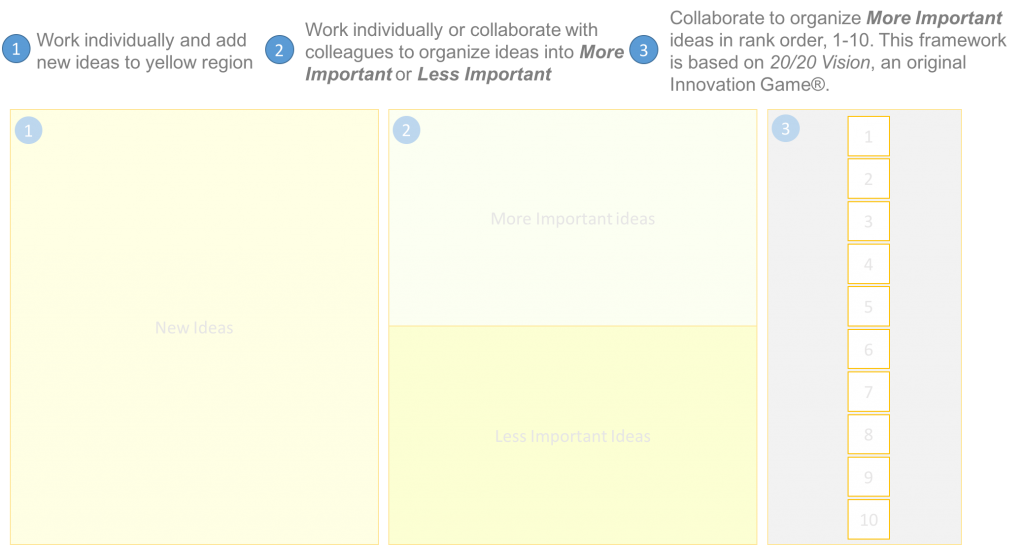
<p>SAFe advocates ensuring that your teams are aligned on business priorities but doesn’t provide a framework for this purpose.</p>

<p>Fortunately, the 20/20 Vision framework is specifically designed to help you build alignment on priorities. Capture your priorities and have your teams prioritize them.</p>

<p><a href="https://weave.conteneo.co/framework/try?id=O2P0OGB2KQEGFWHQ2IMKH4NONIY5HKI0"><img src="/assets/vision-framework.png" alt="vision" /></a></p>

<h3 id="establishing-a-vision">Establishing a Vision</h3>

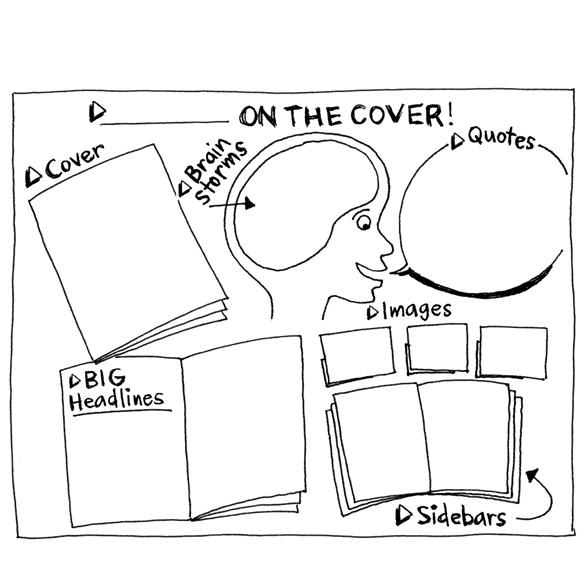
<p>One of the most engaging ways to establish a compelling vision is to use the Product Box framework. Unfortunately, Product Box doesn’t work well with distributed teams, so use On the Cover instead.</p>

<p>This framework asks teams to imagine their release was featured as the cover story in a famous magazine. Capturing the big headlines and crafting a compelling story helps build excitement for your planning session.</p>

<p><a href="https://weave.conteneo.co/framework/try?id=HMZX3CAY4RGGXISUKYIRXOMWT1NRT3BG"><img src="/assets/roadmapping-framework.jpg" alt="roadmapping" /></a></p>

<h3 id="roadmapping--strategic-planning">Roadmapping / Strategic Planning</h3>

<p>Traditional approaches to roadmapping promote overly rigid, linear thinking. We prefer to encourage the growth of your products and services through the Prune the Product Tree framework. Your Themes are represented by branches; candidates for features and capabilities that are represented as apples. And if you have tech debt? No worries – capture that as rotten apples!</p>

<p><a href="https://weave.conteneo.co/framework/try?id=B3GNKGLMRPSNYTVY52GOCMWIODSB02XQ"><img src="/assets/business-value-framework.png" alt="business value" /></a></p>

<h3 id="understanding-business-value">Understanding Business Value</h3>

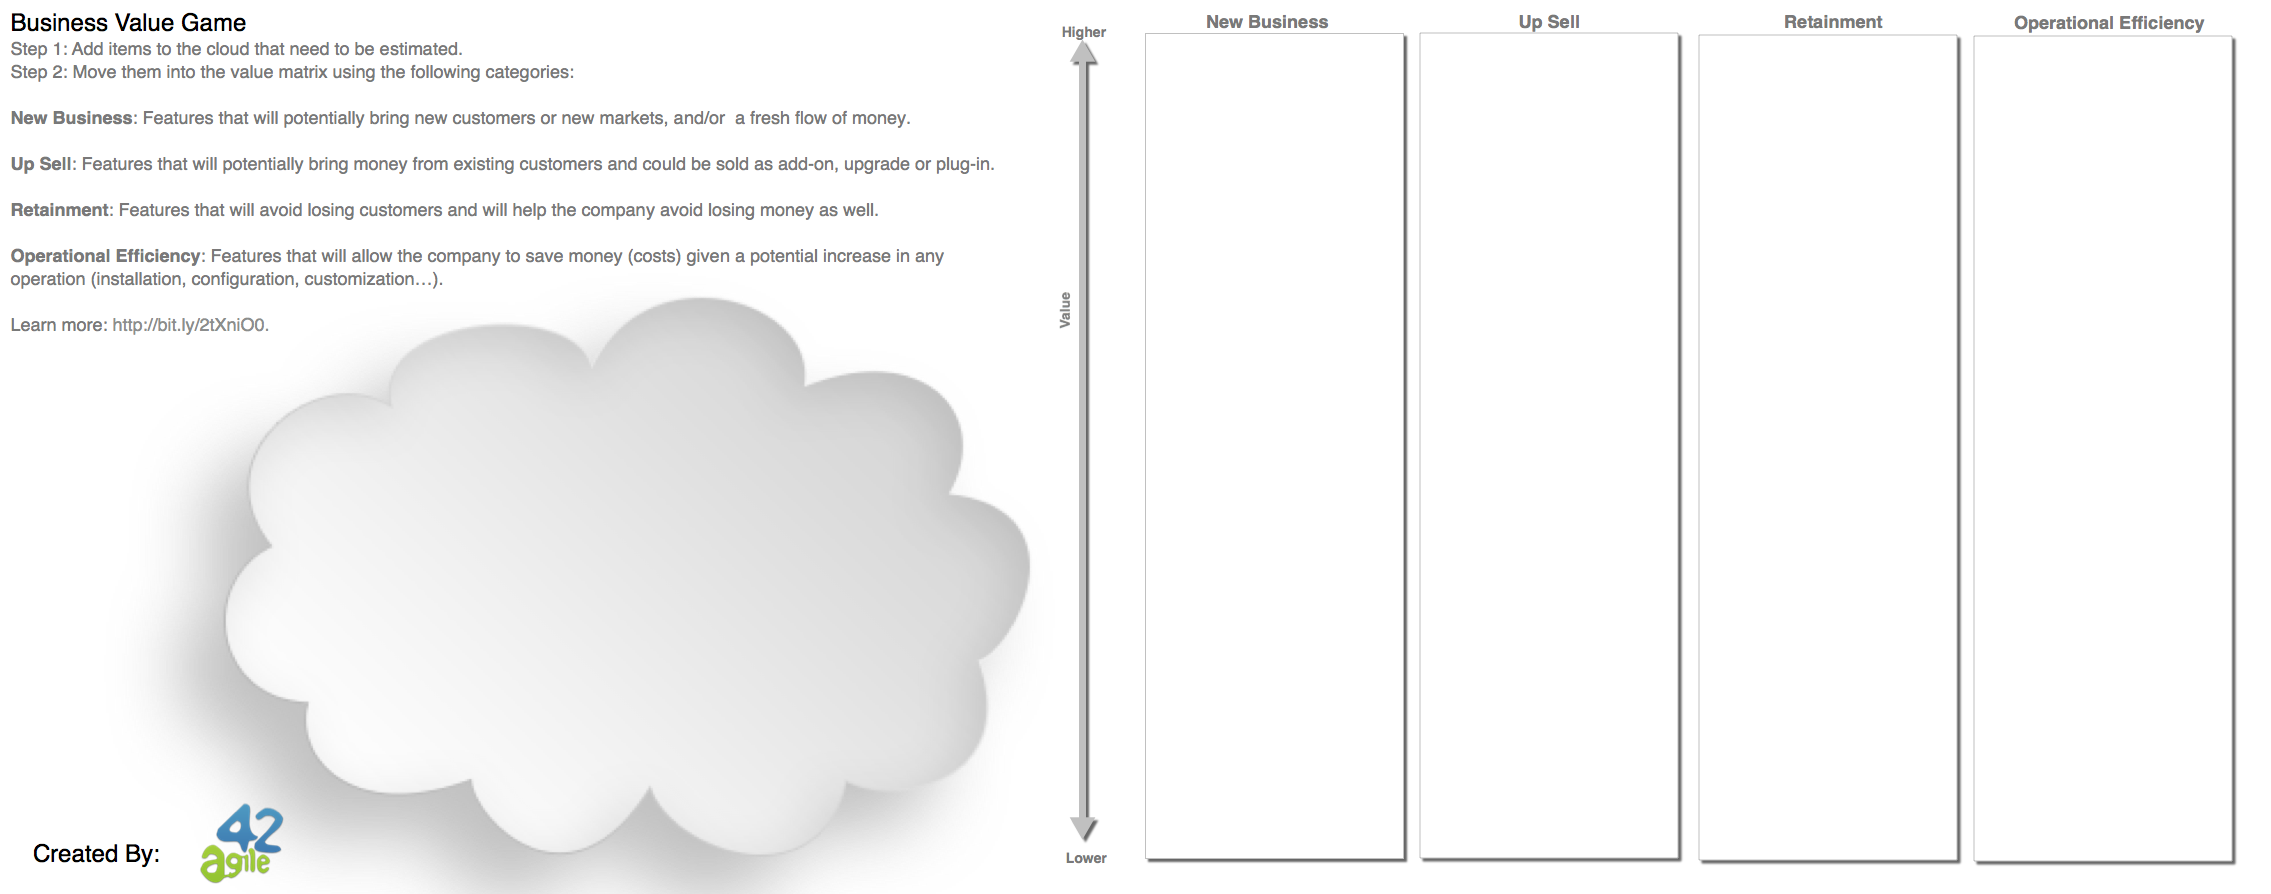
<p>Agile teams produce better results when they understand which Product Backlog Items (PBIs) are associated with new customer revenue, up selling existing customers, retaining customers or improving operations. Our friends at Agile42 created Business Value Poker; helping leaders clarify desired outcomes in these dimensions. Learn more here.</p>

<p><a href="https://weave.conteneo.co/framework/try?id=RISKS_FRAMEWORK_ID"><img src="/assets/risks-framework.png" alt="risks" /></a></p>

<h3 id="identifying-risks-and-enablers">Identifying Risks and Enablers</h3>

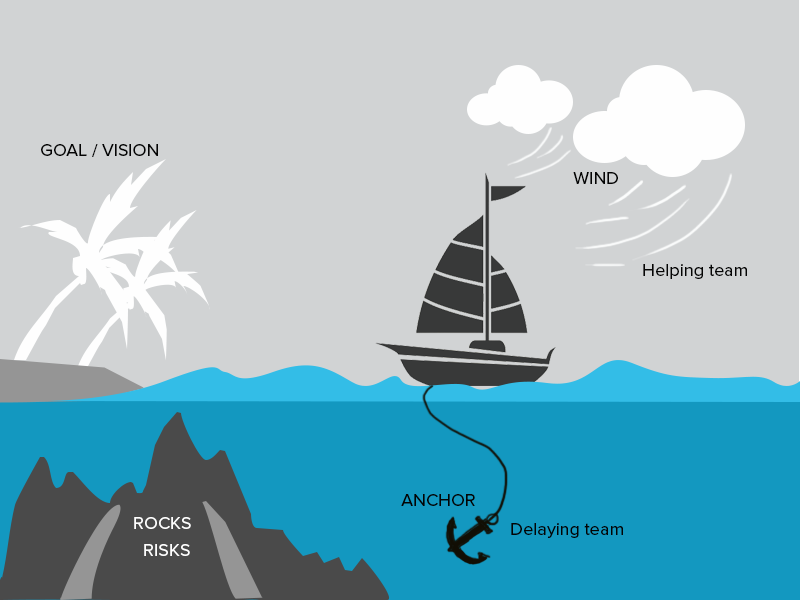
<p>Sailboat is a framework designed to help you see risks in five dimensions and there are a lot of versions of this framework on the web, we like this version as it clearly articulates multiple dimensions of project insight.</p>

<p><a href="https://weave.conteneo.co/framework/try?id=0F24HO0ZAT4MC205ZHKSY0AKAZWR4QT1"><img src="/assets/control-framework.png" alt="control" /></a></p>

<h3 id="understanding-degrees-of-control">Understanding Degrees of Control</h3>

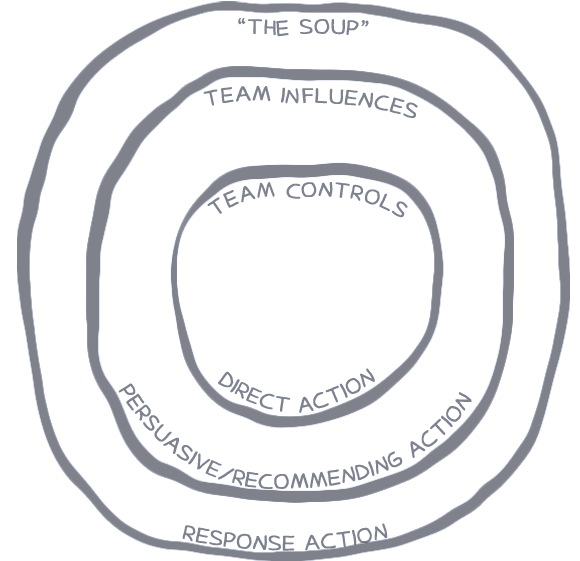
<p>Teams work better when they have a clear understanding of their scope of control. Accordingly, Certified Collaboration Instructor Joel Bancroft-Connors from Applied Frameworks recommends using Diana Larsen’s Circles and Soup.</p>

<p><a href="https://weave.conteneo.co/framework/try?id=4NBBAG1D1FE2WQ05YT20FRZYVEILUWHU"><img src="/assets/scope-framework.png" alt="scope" /></a></p>

<h3 id="negotiating-initial-scope">Negotiating Initial Scope</h3>

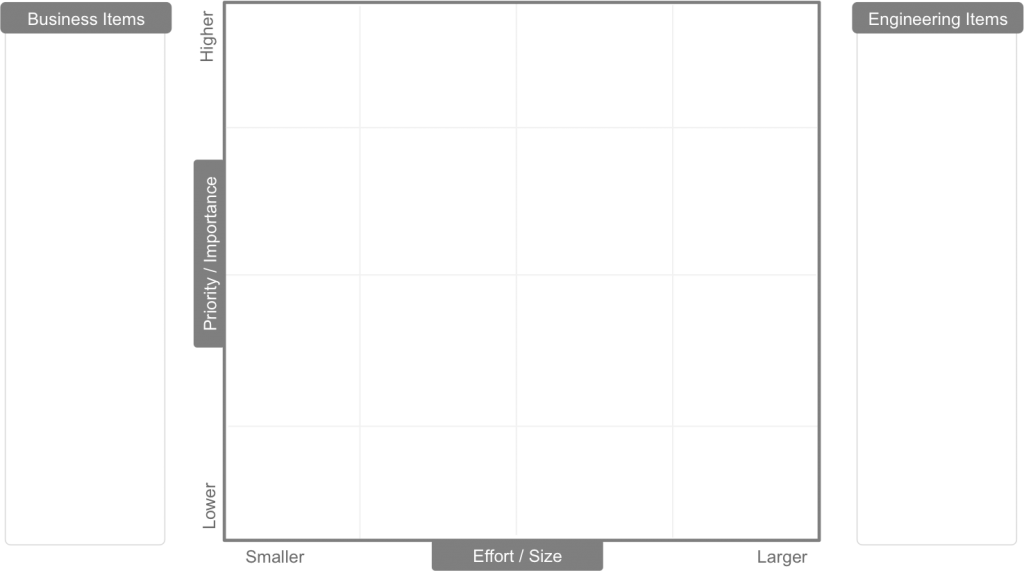
<p>We love the Impact-Effort Matrix for teams to simultaneously consider the important dimension of business value / impact and the orthogonal dimension of effort. Working together, they can identify and shape the highest value, lowest effort Product Backlog Items.</p>

<h2 id="phase-2-analyzing-data">Phase 2: Analyzing Data</h2>

<p>Once you’ve engaged your teams, you will want to leverage the data from Weave to further prepare for your in-person PI planning meeting. Weave makes this easy – just download the forum data, identify key patterns and adjust your in-person PI agenda to leverage the data. We find it helpful to download the completed images from the forums in SVG format and print posters of key artifacts to help the team leverage their own insights. More importantly, you can use the same frameworks both online in Weave and in-person during your PI meeting to create.</p>

<h3 id="now-youre-ready-for-your-pi-planning-meeting">Now You’re Ready for Your PI Planning Meeting!</h3>

<p>With a small amount of up front, online collaboration in Weave you’ll find that your PI Planning meeting is vastly more effective. Weave on!</p>]]></content><author><name>John Heintz</name></author><category term="posts" /><summary type="html"><![CDATA[This is all content that a) comes from https://conteneo.co/, b) is great for distributed teams, and c) I highly recommend and use myself.]]></summary></entry><entry><title type="html">Planning Architectural Evolution with Snapshot Diagrams</title><link href="/2017/05/architectural-snapshot-diagrams/" rel="alternate" type="text/html" title="Planning Architectural Evolution with Snapshot Diagrams" /><published>2017-05-15T17:00:00+00:00</published><updated>2017-05-15T17:00:00+00:00</updated><id>/2017/05/architectural-snapshot-diagrams</id><content type="html" xml:base="/2017/05/architectural-snapshot-diagrams/"><![CDATA[<p><img src="/assets/4sq-arch-diagram-featured.png" alt="4-square architectural diagram" /></p>

<h3 id="a-new-method-for-planning-architectural-evolution-4-square-snapshot-diagrams">A new method for planning architectural evolution, 4-square snapshot diagrams</h3>

<p>Planning evolutionary change is hard, especially for software architecture. I’ve been developing and successfully working with a new visualization tool to help you identify the intermediate steps needed to create a solid architectural plan. After you read this post, you will have learned a concrete planning tool that will better support architectural evolution.</p>

<p>We need to know three things when we plan for the future of our systems. We need to understand:</p>

<ol>
  <li>where we are today</li>
  <li>where we want to be in the future</li>
  <li>what our next steps should be.</li>
</ol>

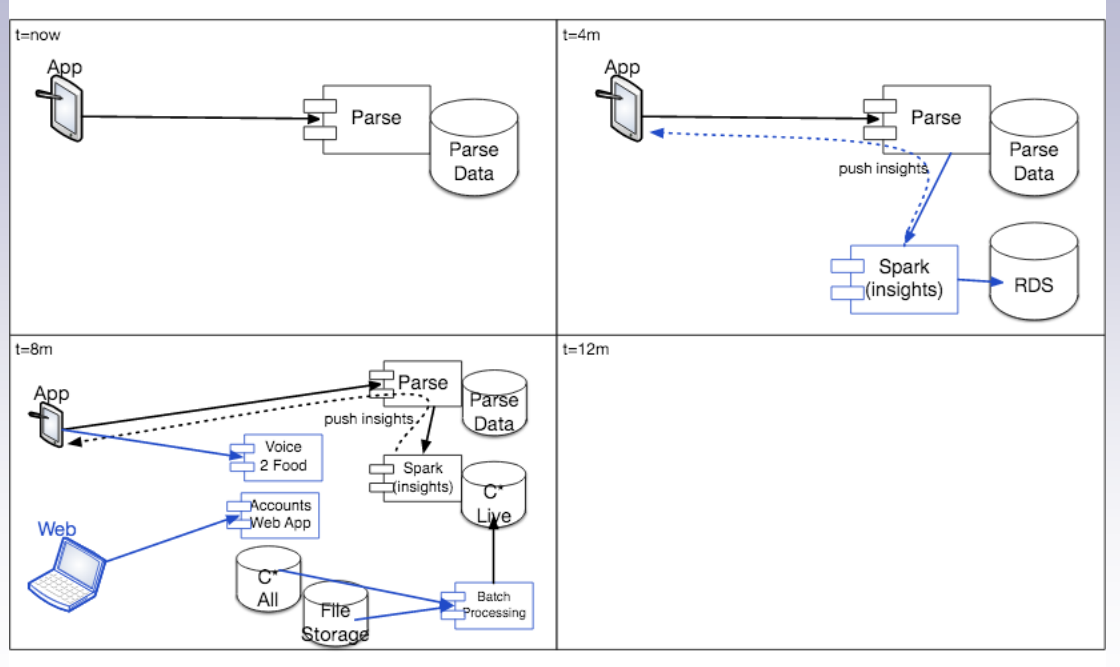
<p>I’m going to demonstrate with two case studies how my new visualization tool, the 4-Square Snapshot Diagram, will cleanly and visually show the above three requirements in a single view.</p>

<p>Before I share my stories, let me give an overview. The 4-Square Snapshot Diagram works by first understanding what we have today and what’s really true. Then, the future vision of the architecture can be created. Finally, with backwards and forwards planning, we define the “steps” along the way towards that future. We will review:</p>

<p>• t=0, or now. What is our current architecture? (High-level logical systems diagram).
• t=24, or the future. What do we want/need to be true in two years?
• t=8, t=16. Working backwards, what intermediate states do we plan to create?</p>

<p>The case studies show how the architectural time frames were chosen to fit within the overall business content. The default is a two year technology plan to set up a three year business plan. Finally, we will discuss the options available to both the future vision and the intermediate steps. There are multiple viable future states, and for each one there are multiple viable paths to get there.</p>

<h3 id="a-large-legacy-system">A Large Legacy System</h3>

<p><img src="/assets/legacy-system-diagram.png" alt="Screenshot 2015-10-12 15.48.13" /></p>

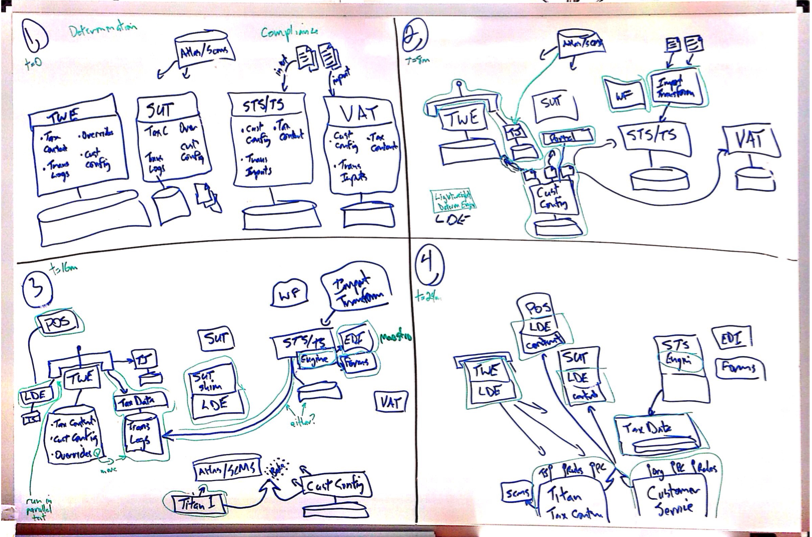
<p>While working with a client they were wrestling with a large legacy system and the future markets and products they could evolve to serve. It would take a year or two to get there though, and we used the 4-square sequence diagram to help visualize, understand, and align everyone on what direction we ought to go.</p>

<h3 id="a-mobile-first-startup">A Mobile-First Startup</h3>

<p><img src="/assets/4sq-arch-diagram.png" alt="4sq arch diagram" /></p>

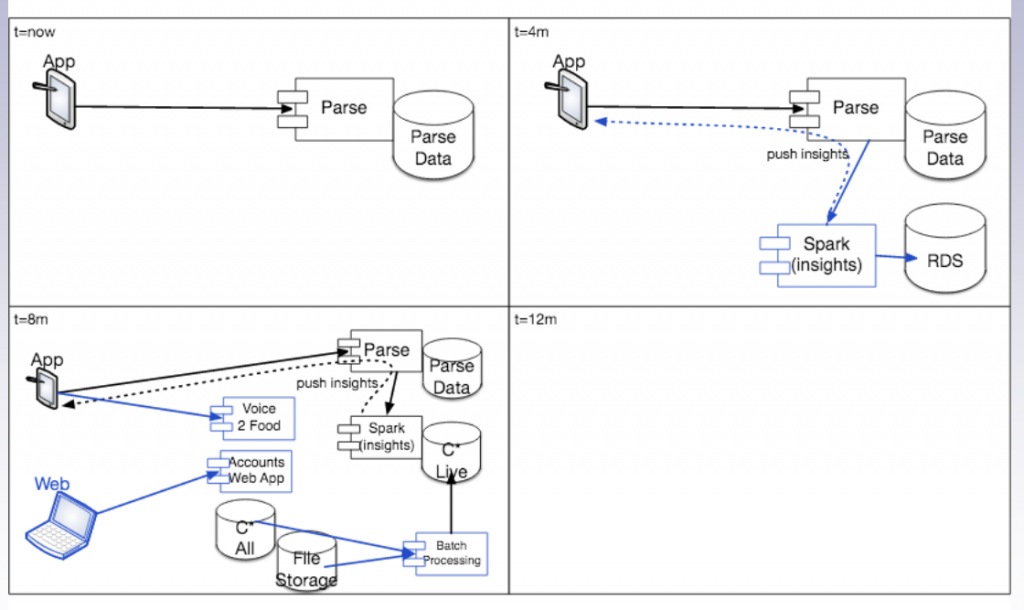
<p>The time horizon for this was much shorter, and that made sense for a startup. We were starting with the simplest thing that could work, and then adding capabilities (and the tech needed to support them) as we grew.</p>

<h3 id="conclusion">CONCLUSION</h3>

<p>You can experiment with this tool immediately and see helpful results. If you want any help please reach out to Gist Labs – we love this kind of work!</p>]]></content><author><name>Livia Grigoras</name></author><category term="posts" /><category term="home" /><summary type="html"><![CDATA[]]></summary></entry><entry><title type="html">A New Problem Solving Technique To Prevent Jumping to Conclusions</title><link href="/2015/05/a-new-problem-solving-technique-to-prevent-jumping-to-conclusions/" rel="alternate" type="text/html" title="A New Problem Solving Technique To Prevent Jumping to Conclusions" /><published>2015-05-01T17:00:00+00:00</published><updated>2015-05-01T17:00:00+00:00</updated><id>/2015/05/a-new-problem-solving-technique-to-prevent-jumping-to-conclusions</id><content type="html" xml:base="/2015/05/a-new-problem-solving-technique-to-prevent-jumping-to-conclusions/"><![CDATA[<p><img src="/assets/white-board-featured.jpg" alt="White board" /></p>

<h2 id="the-three-color-problem-solving-technique">The Three-Color Problem Solving Technique</h2>

<h3 id="hide-the-blue-markers-a-tool-you-can-use-to-analyze-and-fix-complex-problems">Hide the Blue Markers: A tool you can use to analyze and fix complex problems</h3>

<p>You have a problem. It’s a big problem and you’re not exactly sure what it is, much less how to fix it. When you start discussing the problem with your team, you find that some team members are jumping to conclusions and you haven’t even outlined the entire problem.</p>

<p>This is the simplest problem solving tool I’ve used to help a team completely define and analyze a problem before creating any solutions. I discovered this technique by accident, a happy accident. Here’s how it came about.</p>

<h3 id="hide-the-blue-markers-how-this-solution-came-about">Hide the Blue Markers: How This Solution Came About</h3>

<p>Several years ago, I was working with a team and one day, we started experiencing a production issue. The systems were behaving slowly everywhere: the process queues were backing up; the application servers were nearly idle: the databases were nearly idle; no thread locks or contention could be found. There were many different components and subsystems at play and it was not obvious what was going on. It was quite a mysterious problem.</p>

<p>The team organized into a meeting room to figure out what was going on, what they should do, and I was invited to join them.</p>

<h3 id="jumping-to-solutions">Jumping to Solutions</h3>

<p>As we dove into the conversation to understand things, I asked the group to step back a moment and draw a systems diagram to show and teach me what was going on – because I didn’t know what was present.</p>

<p><img src="/assets/black-ink-problem-solving.jpg" alt="Black Ink One Problem Solving Tool" /></p>

<p>We used black markers to draw the systems diagram, showing the client components, the communication channels, the various server components and processes and databases and so on.</p>

<p><img src="/assets/red-marker-problem-areas.jpg" alt="Use Red Marker to denote problem areas" /></p>

<p>As we were drawing the systems diagram, we also agreed to use red markers to show the problem areas: where things were going wrong, or where we thought there were risks of failures. As certain risks were marked in red, some individuals would get an “aha” and then jump to leave the room and go fix it.</p>

<p>I literally watched people leap to solutions. I was fascinated.</p>

<p>As the meeting progressed, the team used blue markers to denote solutions. Although I cautioned the team to “not leap to conclusions,” they still did. It was amazing seeing individuals yet again try to jump up and go do something. Yet, we hadn’t even finished fully describing all of the system. And we hadn’t finished describing all of the possible problems, risks, or failures.</p>

<h3 id="one-color-at-a-time">One Color at a Time</h3>

<p>I began actively facilitating the meeting. I gathered all of the markers in the room and set a meeting rule: “We can’t move on to the next color until we’re finished with the color that we’re on.” That meant that we had to finish using the black marker to define the current systems diagrams and the things that we knew to be true. No more red or blue markers for a while.</p>

<p>Once we all agreed to this new rule, we moved on. We used black until everyone agreed, with a head nod, that we had captured the current system as we knew it. Then, we picked up the red markers and annotated the diagram focusing on the problem areas, where things were going wrong and potential risks. Whenever ideas or solutions came up, we politely deferred those to when we were ready for the final phase: the solutions phase where we would get to use the blue marker.</p>

<p>After the red marker annotations were completed and everyone nodded their heads that we had gotten everything, we moved to the blue marker. We noted ideas, suggestions, things we could try and investigate. And that went on for a short while.</p>

<h3 id="the-full-picture">The Full Picture</h3>

<p>When we finished this process we had a pretty good view of the whole picture. We understood the components that were there, we understood what all of the possible things were that could be wrong and where they could go wrong, plus, we had a set of suggestions for what we could do about them. It was actually very easy to prioritize what we ought to do next. In fact, some of the suggestions made in blue were quite obvious choices.</p>

<p>At the end of the meeting, we had come to a good decision that worked well for us and we moved on.</p>

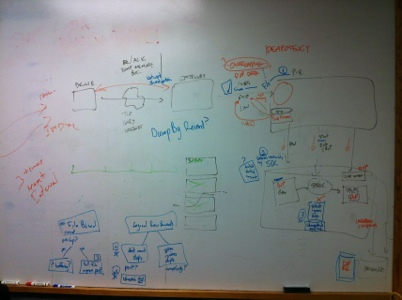
<p>Here is an actual first use of this technique (we used BLACK, RED, BLUE marker colors) that the team still talks about helping them not jump to conclusions.</p>

<p><img src="/assets/three-color-problem-solving.jpg" alt="Three color problem solving" /></p>

<h3 id="dont-jump-to-conclusions">Don’t Jump to Conclusions</h3>

<p>So, now you know why I call the story “Hide the Blue Markers.” Drawing (literally) conclusions before you’ve really examined the problem is detrimental to your process. I highly recommend using the Three-Color Problem Solving tool when your team has a problem and you can’t figure out the entire problem, nor the entire solution.</p>

<h2 id="how-to-hold-a-three-color-problem-solving-session">How to Hold a Three-Color Problem Solving Session</h2>

<ol>
  <li>Grab three colored markers: black, red and green.</li>
  <li>Meet at the whiteboard (or use a large piece of paper).</li>
  <li>Ask all team members to the join the meeting.</li>
</ol>

<h3 id="pen-colors-and-their-meaning">Pen Colors and Their Meaning</h3>

<p>• The black pen is used for diagramming and identifying facts.
• The red pen is used for identifying challenges or problems.
• The green pen, however, is used for documenting potential solutions. This is the pen you need to hide. (In my story, “Hide the Blue Markers,” we were using blue rather than green).</p>

<h4 id="the-rules">The Rules:</h4>

<ol>
  <li>Only one color may be used at a time.</li>
  <li>You can not move on to the next color until everyone agrees that everything is covered by the first color.</li>
  <li>You can return to a previous color if you discover you missed something.</li>
</ol>

<h4 id="the-process">The Process:</h4>

<ol>
  <li>Draw in BLACK the things you know for sure. (Systems diagram, current measurements, list of assumptions, …) Keep adding to this until everyone agrees it’s accurate and reasonably complete. Keep asking, “What have we missed?” Get full consensus that all things are drawn in black.</li>
  <li>Annotate this diagram with RED for challenges, concerns, or big questions. Keep adding RED until everyone agrees everything is captured. You MAY add more BLACK notes if missing information comes up. NO GREEN may be used at all!</li>
  <li>Start annotating GREEN to mark ideas, solutions, and next steps. Do this until everyone agrees everything is captured.</li>
</ol>

<p>When your diagram is done, you should have a full picture of facts, concerns and possible solutions. From here, you can use a method to sort which solutions should be addressed first. (I’ve used dot voting to great effect).</p>

<p>The Three-Color Problem Solving Tool is an effective technique for helping your team examine a large, complex problem. By hiding the green marker, the one meant for solutions, you will prevent your team members from jumping to conclusions, while helping them completely define and understand the problem before creating solutions.</p>

<p>Please let me know if this technique works for you, or if you’d like some help facilitating it’s use in your organization.</p>]]></content><author><name>John Heintz</name></author><category term="posts" /><summary type="html"><![CDATA[]]></summary></entry><entry><title type="html">The Outbox: An EIP Pattern</title><link href="/2014/05/the-outbox/" rel="alternate" type="text/html" title="The Outbox: An EIP Pattern" /><published>2014-05-23T17:00:00+00:00</published><updated>2014-05-23T17:00:00+00:00</updated><id>/2014/05/the-outbox</id><content type="html" xml:base="/2014/05/the-outbox/"><![CDATA[<p><img src="/assets/outbox-featured.jpg" alt="Outbox" /></p>

<h2 id="the-outbox">The Outbox</h2>

<p>The outbox pattern, I believe, is missing from the <a href="http://amazon.com/o/asin/0321200683/ref=nosim/enterpriseint-20">Enterprise Integration Patterns</a> book. This pattern is exactly like the local outbox that email clients have for disconnected operation.</p>

<p>How can producers reliably send messages when the broker/consumer is unavailable?</p>

<p>The producer of messages can durably store those messages in a local outbox before sending to a <a href="http://www.eaipatterns.com/MessageEndpoint.html">Message Endpoint</a>. The durable local storage may be implemented in the <a href="http://www.eaipatterns.com/MessageChannel.html">Message Channel</a> directly, especially when combined with Idempotent Messages.</p>

<p>This pattern is implied in the book inside the <a href="http://www.eaipatterns.com/GuaranteedMessaging.html">Guaranteed Messaging</a> pattern. See the “Computer 1 Disk” inside the image.</p>

<p>This pattern avoids the following [The Lost Send]:</p>

<ol>
  <li>Producer sends a message.</li>
  <li>The Message Channel is temporarily unavailable.</li>
  <li>Messages will queue locally and periodically retry sending.</li>
</ol>

<p>This pattern can be used to minimize [The Premature Send]:</p>

<ol>
  <li>Producer sends a message within the context of some local processing scope or transactional boundary.</li>
  <li>After sending the message, but still within the same processing scope, the producer aborts and rolls back local changes.</li>
  <li>The message may already have been sent and processed.</li>
  <li>Either:
    <ol>
      <li>The Producer can send another compensation message to undo actions,</li>
      <li>or the producer can first store messages in the Outbox and then at the end of the scope push or purge local messages.</li>
    </ol>
  </li>
</ol>]]></content><author><name>John Heintz</name></author><category term="patterns" /><summary type="html"><![CDATA[]]></summary></entry><entry><title type="html">Don’t Blame the Capital Letters</title><link href="/2014/05/dont-blame-the-capital-letters/" rel="alternate" type="text/html" title="Don’t Blame the Capital Letters" /><published>2014-05-22T17:00:00+00:00</published><updated>2014-05-22T17:00:00+00:00</updated><id>/2014/05/dont-blame-the-capital-letters</id><content type="html" xml:base="/2014/05/dont-blame-the-capital-letters/"><![CDATA[<p><img src="/assets/capital-letters-featured.jpg" alt="Capital Letters" /></p>

<p>After seeing several references to a blog post [1] attacking DevOps as the cause of harm. This morning I saw it again and quipped:</p>

<blockquote>
  <p>Nothing with a capital letter is the root cause of any problem: #Agile, #DevOps, … Look to lowercase words: trust, collab, purpose, people</p>

  <p>— John Heintz (@jheintz) <a href="https://twitter.com/jheintz/statuses/469498234025414657">May 22, 2014</a></p>
</blockquote>

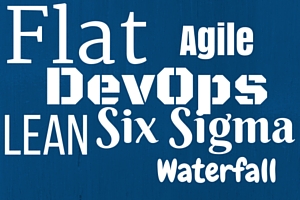
<p>Examples of capital letter branded ideas/processes/frameworks that I’ve personally seen blamed for all manner of ills include Agile, Lean, DevOps, Six Sigma, DevOps, Flat and Hierarchical Org Structures, and Waterfall. However, all of these are simply “thinking tools” that can be used for good or evil. I reject that these tools can be the underlying cause of any of these ills.</p>

<p>(I don’t even blame Waterfall for many of the death marches in its wake. Waterfall is <em>supposed</em> to have feedback loops and we should collectively re-examine a plan that isn’t working. Waterfall isn’t ignoring those things, project leaders and management are!)</p>

<p>Instead, we should look towards essential aspects of human nature: trust, collaboration, purpose, autonomy, safety, thinking about the future, honesty, value, growth, learning, and any others that affect how we socially interact.</p>

<p>[1] The topic is DevOps and the post is here: https://www.jeffknupp.com/blog/2014/04/15/how-devops-is-killing-the-developer/ and I can certainly sympathize with some of the pains and failings written there.</p>]]></content><author><name>John Heintz</name></author><category term="agile" /><summary type="html"><![CDATA[]]></summary></entry><entry><title type="html">Keynote at the Lean India Summit 2013, Work Visualization</title><link href="/2014/01/keynote-at-the-lean-india-summit-2013-work-visualization/" rel="alternate" type="text/html" title="Keynote at the Lean India Summit 2013, Work Visualization" /><published>2014-01-15T00:00:00+00:00</published><updated>2014-01-15T00:00:00+00:00</updated><id>/2014/01/keynote-at-the-lean-india-summit-2013-work-visualization</id><content type="html" xml:base="/2014/01/keynote-at-the-lean-india-summit-2013-work-visualization/"><![CDATA[<p>At the <a href="http://leanindiasummit.com/">Lean India Summit 2013</a> conference in Bangalore I gave the following keynote presentation:</p>

<iframe title="Work visualizations" src="https://www.slideshare.net/slideshow/embed_code/key/HwdapZVLC7BMVv" width="427" height="356" frameborder="0" marginwidth="0" marginheight="0" scrolling="no" style="border:1px solid #CCC; border-width:1px; margin-bottom:5px; max-width: 100%;" allowfullscreen=""> </iframe>

<p><a href="https://www.slideshare.net/johnheintz/work-visualizations">Work visualizations</a> from <a href="https://www.slideshare.net/johnheintz">johnheintz</a></p>

<p>In this presentation I describe various techniques I’ve used that have been useful for helping individuals and teams see, manage, and accomplish work.</p>

<ul>
  <li>Personal Kanban for individuals</li>
  <li>Team Kanban boards for team collaboration</li>
  <li>Multi-team coordination and Release Planning for streams of parallel work</li>
  <li>Program modeling to tie threads together</li>
  <li>Multi-Layer Roadmapping for long term collaborative planning</li>
</ul>

<p>Please comment on other styles of visualization that have worked for you!</p>]]></content><author><name>John Heintz</name></author><category term="posts" /><summary type="html"><![CDATA[At the Lean India Summit 2013 conference in Bangalore I gave the following keynote presentation:]]></summary></entry><entry><title type="html">The User Story</title><link href="/2013/11/the-user-story/" rel="alternate" type="text/html" title="The User Story" /><published>2013-11-01T00:00:00+00:00</published><updated>2013-11-01T00:00:00+00:00</updated><id>/2013/11/the-user-story</id><content type="html" xml:base="/2013/11/the-user-story/"><![CDATA[<p>As a product manager, I want to better understand and articulate requirements so that I can more effectively guide development to create value.</p>

<p>Agile User Stories have become the lingua franca of all agile requirements, and this simple construct is an incredibly effective way to encode and share requirements.</p>

<p>This one little sentence contains the answers to the most powerful questions of value creation and product management:</p>

<p>Who, What, Why</p>

<p>Here’s the story format again:</p>

<p>As a <who>, I want <what>, because <why>.</why></what></who></p>

<p>Notice, crucially, we don’t have How. That is never part of a user story. The user doesn’t care how, and it’s premature to start specifying it in this requirement.</p>

<p>Finally, I want to comment that if you’ve written the Why and you haven’t rewritten the Who and the What… then I recommend you take another look.</p>]]></content><author><name>John Heintz</name></author><category term="posts" /><summary type="html"><![CDATA[As a product manager, I want to better understand and articulate requirements so that I can more effectively guide development to create value.]]></summary></entry><entry><title type="html">Video Sequential and Collaborative Planning</title><link href="/2013/09/video-sequential-and-collaborative-planning/" rel="alternate" type="text/html" title="Video Sequential and Collaborative Planning" /><published>2013-09-20T00:00:00+00:00</published><updated>2013-09-20T00:00:00+00:00</updated><id>/2013/09/video-sequential-and-collaborative-planning</id><content type="html" xml:base="/2013/09/video-sequential-and-collaborative-planning/"><![CDATA[<p>This is the first video in a new series, Gist Labs’ Experiments in Video.</p>

<p>I’m very happy to be joined by my friend Matt Roberts. Matt is a Senior Director of Software Engineering at CA Technologies and someone I respect as a true leader in addition to being a manager.</p>

<p>The topic for this cast is planning models, and how to arrange a plan either fundamentally in sequence or as a collaboration. This diagrams are essentially the same pictures I’ve drawn on dozens of white boards. Whether it’s work with teams struggling to get done-done within a sprint or programs struggling with cross-team dependencies, the picture is the same every time.</p>

<p>Please watch this short (less than 9 minute) video, share it with those who plan work for themselves or others, and comment on what you like or dislike about these ideas!</p>

<div class="ast-oembed-container " style="height: 100%;"><iframe title="SequentialCollaborativePlanning" width="1200" height="900" src="https://www.youtube.com/embed/2aho4WbJprg?feature=oembed" frameborder="0" allow="accelerometer; autoplay; clipboard-write; encrypted-media; gyroscope; picture-in-picture" allowfullscreen=""></iframe></div>
<p>(Update: Different link… now with louder volume.)</p>]]></content><author><name>John Heintz</name></author><category term="posts" /><summary type="html"><![CDATA[This is the first video in a new series, Gist Labs’ Experiments in Video.]]></summary></entry><entry><title type="html">Video Motivation for Agile</title><link href="/2013/09/video-motivation-for-agile/" rel="alternate" type="text/html" title="Video Motivation for Agile" /><published>2013-09-15T00:00:00+00:00</published><updated>2013-09-15T00:00:00+00:00</updated><id>/2013/09/video-motivation-for-agile</id><content type="html" xml:base="/2013/09/video-motivation-for-agile/"><![CDATA[<p>I had the good fortune to work with <a href="http://innovationgames.com">The InnovationGames® Company</a> and record some videos on Agile and DevOps topics.</p>

<p>This video explains why Agile is different and often better than a predictive or waterfall planning and execution model:</p>

<div class="ast-oembed-container " style="height: 100%;"><iframe title="20130307 Motivation for Agile" src="https://player.vimeo.com/video/66268000?dnt=1&amp;app_id=122963&amp;h=7b810b539b" width="1200" height="675" frameborder="0" allow="autoplay; fullscreen; picture-in-picture" allowfullscreen=""></iframe></div>]]></content><author><name>John Heintz</name></author><category term="posts" /><summary type="html"><![CDATA[I had the good fortune to work with The InnovationGames® Company and record some videos on Agile and DevOps topics.]]></summary></entry><entry><title type="html">Video Business Impact DevOps</title><link href="/2013/09/video-business-impact-devops/" rel="alternate" type="text/html" title="Video Business Impact DevOps" /><published>2013-09-10T00:00:00+00:00</published><updated>2013-09-10T00:00:00+00:00</updated><id>/2013/09/video-business-impact-devops</id><content type="html" xml:base="/2013/09/video-business-impact-devops/"><![CDATA[<p>I had the good fortune to work with The InnovationGames® Company and record some videos on Agile and DevOps topics.</p>

<p>This video is Luke Hohmann and me being interviewed on the the selling and buying process for agile infrastructure and DevOps technology. The value proposition is based on speed and quality to production:</p>

<div class="ast-oembed-container " style="height: 100%;"><iframe title="20130308 Business Impact Selling DevOps Go-To Market" src="https://player.vimeo.com/video/66268001?dnt=1&amp;app_id=122963" width="1200" height="675" frameborder="0" allow="autoplay; fullscreen; picture-in-picture" allowfullscreen=""></iframe></div>]]></content><author><name>John Heintz</name></author><category term="posts" /><summary type="html"><![CDATA[I had the good fortune to work with The InnovationGames® Company and record some videos on Agile and DevOps topics.]]></summary></entry></feed>