Visualizing Work
Work can be hard enough, it doesn’t need to be invisible!
NOTE: Please fill out the “contact us” form on the right, or just leave a comment asking, if you’d like to be notified when the future webinar series on this topic is scheduled.
Here is a selection of visualizations that I find very helpful when managing work, either my own work or an organization’s work with 22 teams.
Roadmaps
Roadmap connect multiple high-level threads together over many quarters or years. They answer the questions of Who, When, How Often, What, Why, and How. Some can be sparse and others very (over) loaded. Here is a quarter of a year long roadmap that shows the various connected teams and how their work is connected:
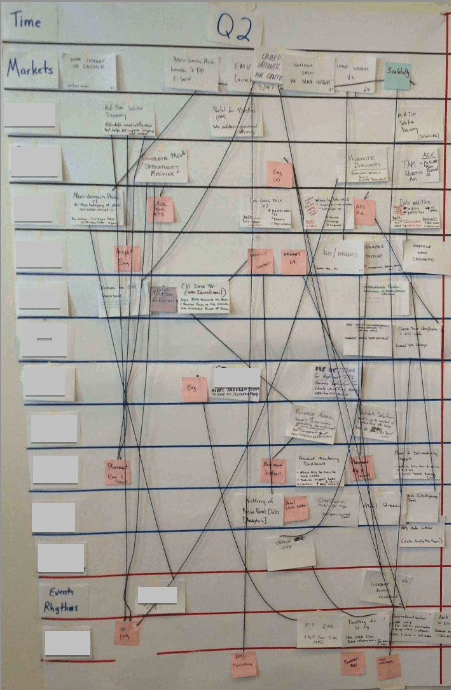
This roadmap exposes the actual complexity of the current work management system.
Program Management
A program is a work managed towards a specific goal. Programs are larger than any one team and take longer than any near-term planning horizon. Here is a small visualization of a program from an unreleased tool. Work is pulled from the right, always completing towards the valuable goal on the left.

A program of work is more structured than just a list of items, as an Agile backlog often is. Often, a program makes an excellent wrapper around the bulk of the agile backlog. programs tend to important integration milestones and reviews that provide a natural tightening shape.
Agile Release (Quarterly) Plans
Agile “release” planning covers the scope of multiple sprints. I usually suggest quarterly planning but this could be anything from one to six months. This planning does need to include multiple sprint ahead, in order to gain the benefit of coordinating dependencies across teams (or dependencies will become unplanned interruptions).
First, we see a multi-team release plan based on sequential dependencies. Here a project or program named “A” is works on by several teams.
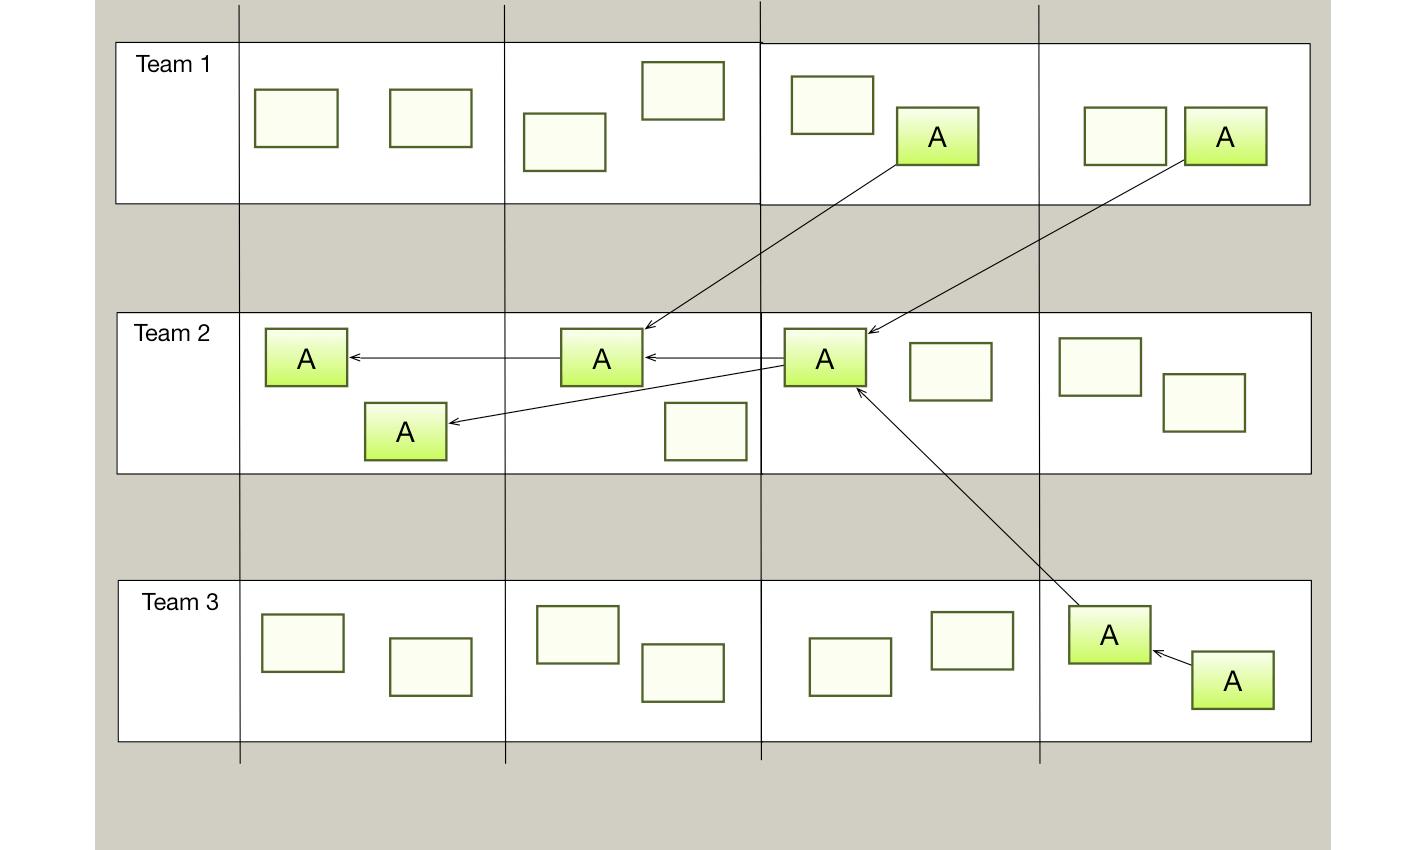
This sequential style of work management has the disadvantages that the plan must be “right” and any delays can cause havoc at the end of the timeframe.
Next, we see a multi-team collaborative model for work management. In this case teams are working directly together at various times to collaborate on the work.
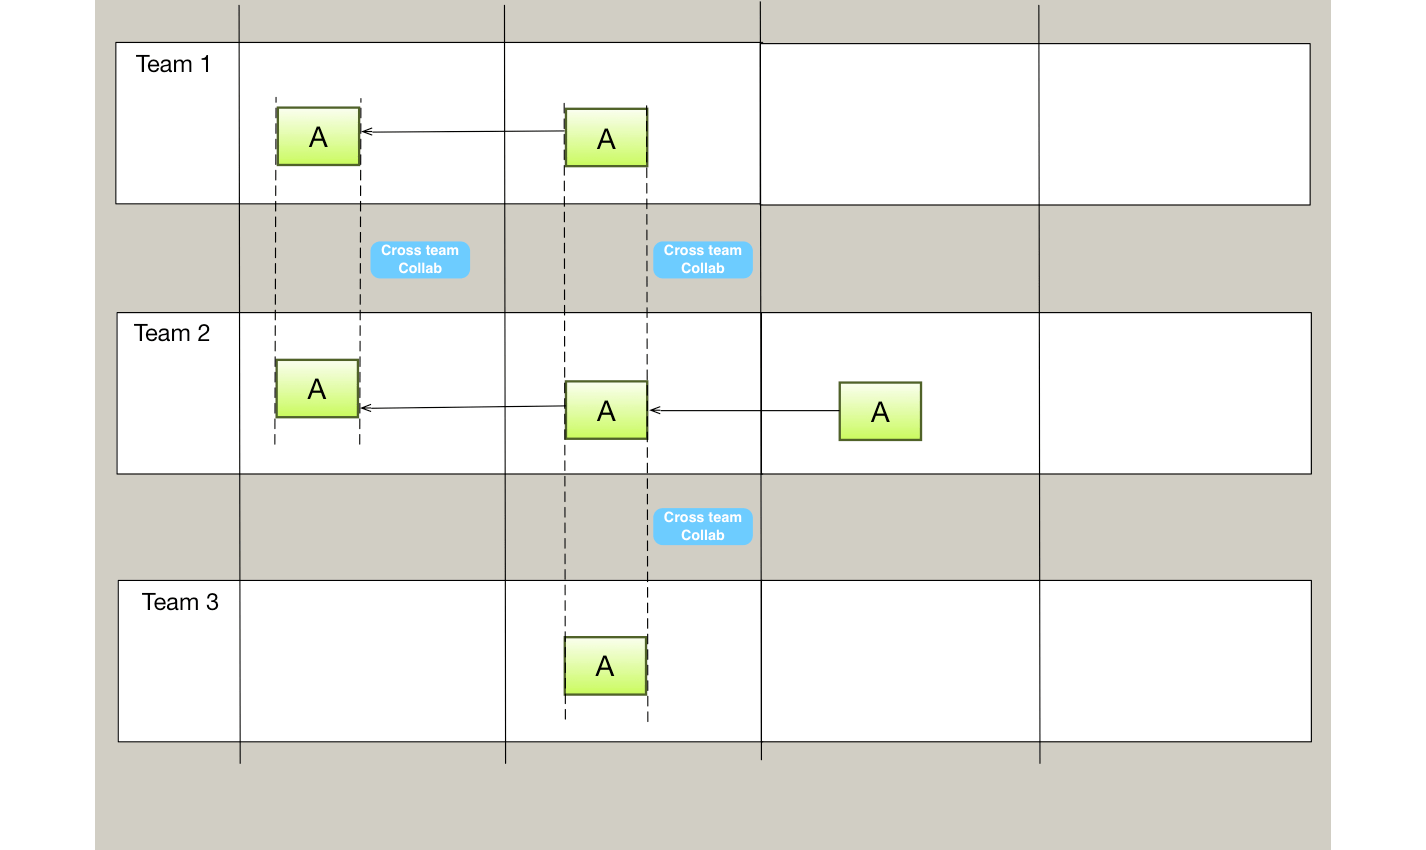
Notice in this more collaborative style that there are fewer elements to manage. This is actually a simpler way to manage work, but the actual collaborative activity will be highly messy and fast-paced.
Personal and Team Work
Visual Boards have long been useful for individual and team work. Here is the simplest example, showing Ready-InProgress-Done designations for work.

Here is another example, with both more states for work to move through (columns) and more specific routes that work can travel (rows).

These more details work management boards have two key values:
- They show what is actually happening now
- They indicate what you should do next
Something these boards don’t do well is provide the connection to the big picture. There are some variations on these (called 2-tier kanban boards) that show one level up, but this doesn’t give enough visibility when we are working on a single activity for a program or roadmap level goal.
Common Abstractions
All of these visualizations have a few things in common.
- They use space and structure, and sometimes lines, to indicate meaning and relationships
- They have a direction, work is either approach from left (time) or right (priority)