Planning Architectural Evolution with Snapshot Diagrams

A new method for planning architectural evolution, 4-square snapshot diagrams
Planning evolutionary change is hard, especially for software architecture. I’ve been developing and successfully working with a new visualization tool to help you identify the intermediate steps needed to create a solid architectural plan. After you read this post, you will have learned a concrete planning tool that will better support architectural evolution.
We need to know three things when we plan for the future of our systems. We need to understand:
- where we are today
- where we want to be in the future
- what our next steps should be.
I’m going to demonstrate with two case studies how my new visualization tool, the 4-Square Snapshot Diagram, will cleanly and visually show the above three requirements in a single view.
Before I share my stories, let me give an overview. The 4-Square Snapshot Diagram works by first understanding what we have today and what’s really true. Then, the future vision of the architecture can be created. Finally, with backwards and forwards planning, we define the “steps” along the way towards that future. We will review:
• t=0, or now. What is our current architecture? (High-level logical systems diagram). • t=24, or the future. What do we want/need to be true in two years? • t=8, t=16. Working backwards, what intermediate states do we plan to create?
The case studies show how the architectural time frames were chosen to fit within the overall business content. The default is a two year technology plan to set up a three year business plan. Finally, we will discuss the options available to both the future vision and the intermediate steps. There are multiple viable future states, and for each one there are multiple viable paths to get there.
A Large Legacy System
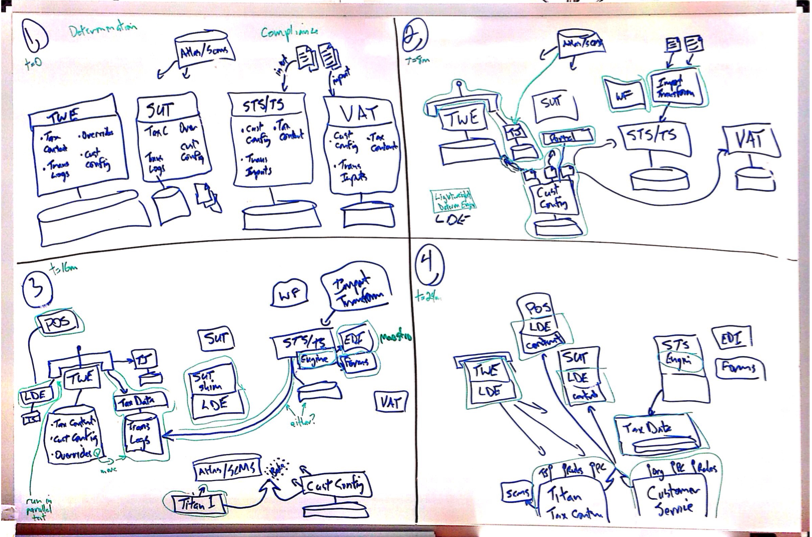
While working with a client they were wrestling with a large legacy system and the future markets and products they could evolve to serve. It would take a year or two to get there though, and we used the 4-square sequence diagram to help visualize, understand, and align everyone on what direction we ought to go.
A Mobile-First Startup
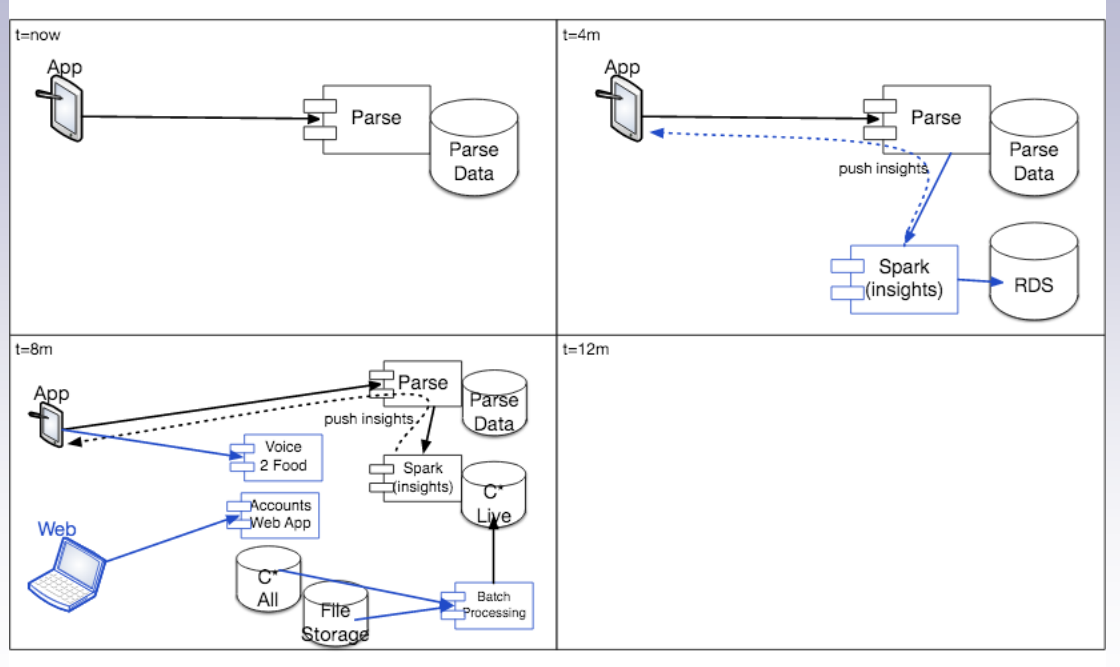
The time horizon for this was much shorter, and that made sense for a startup. We were starting with the simplest thing that could work, and then adding capabilities (and the tech needed to support them) as we grew.
CONCLUSION
You can experiment with this tool immediately and see helpful results. If you want any help please reach out to Gist Labs – we love this kind of work!